


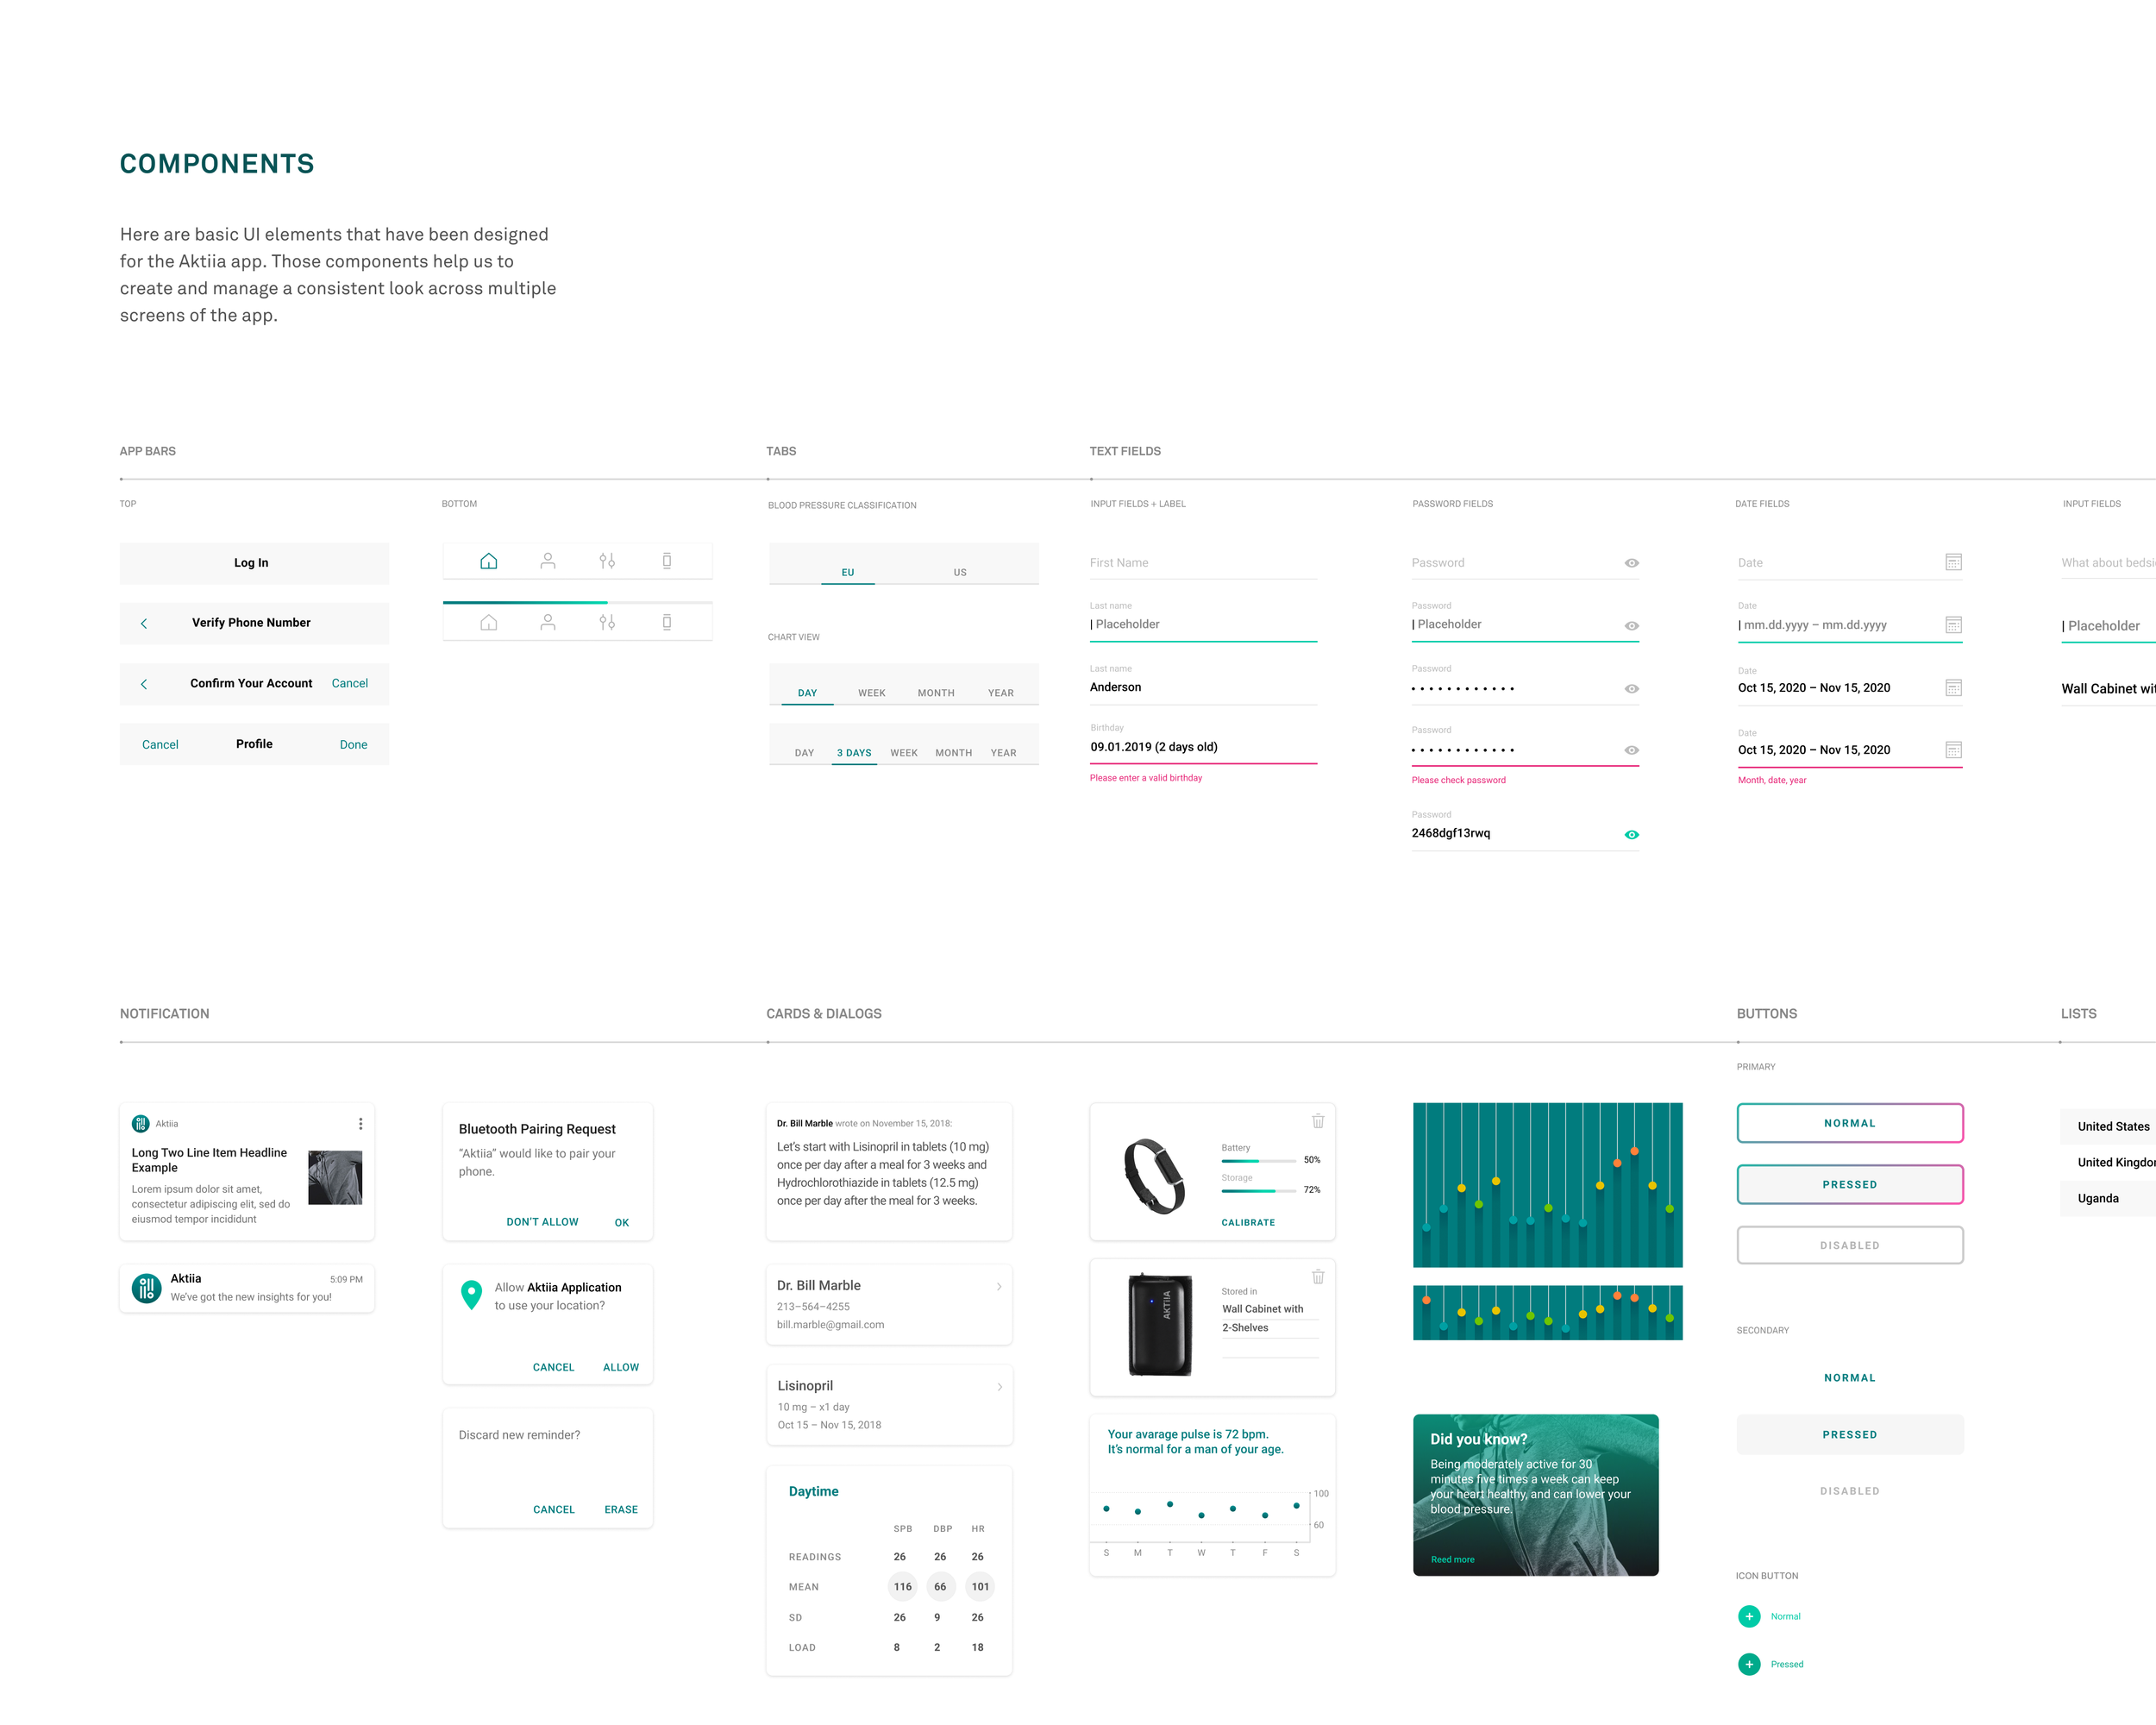


Home page structure
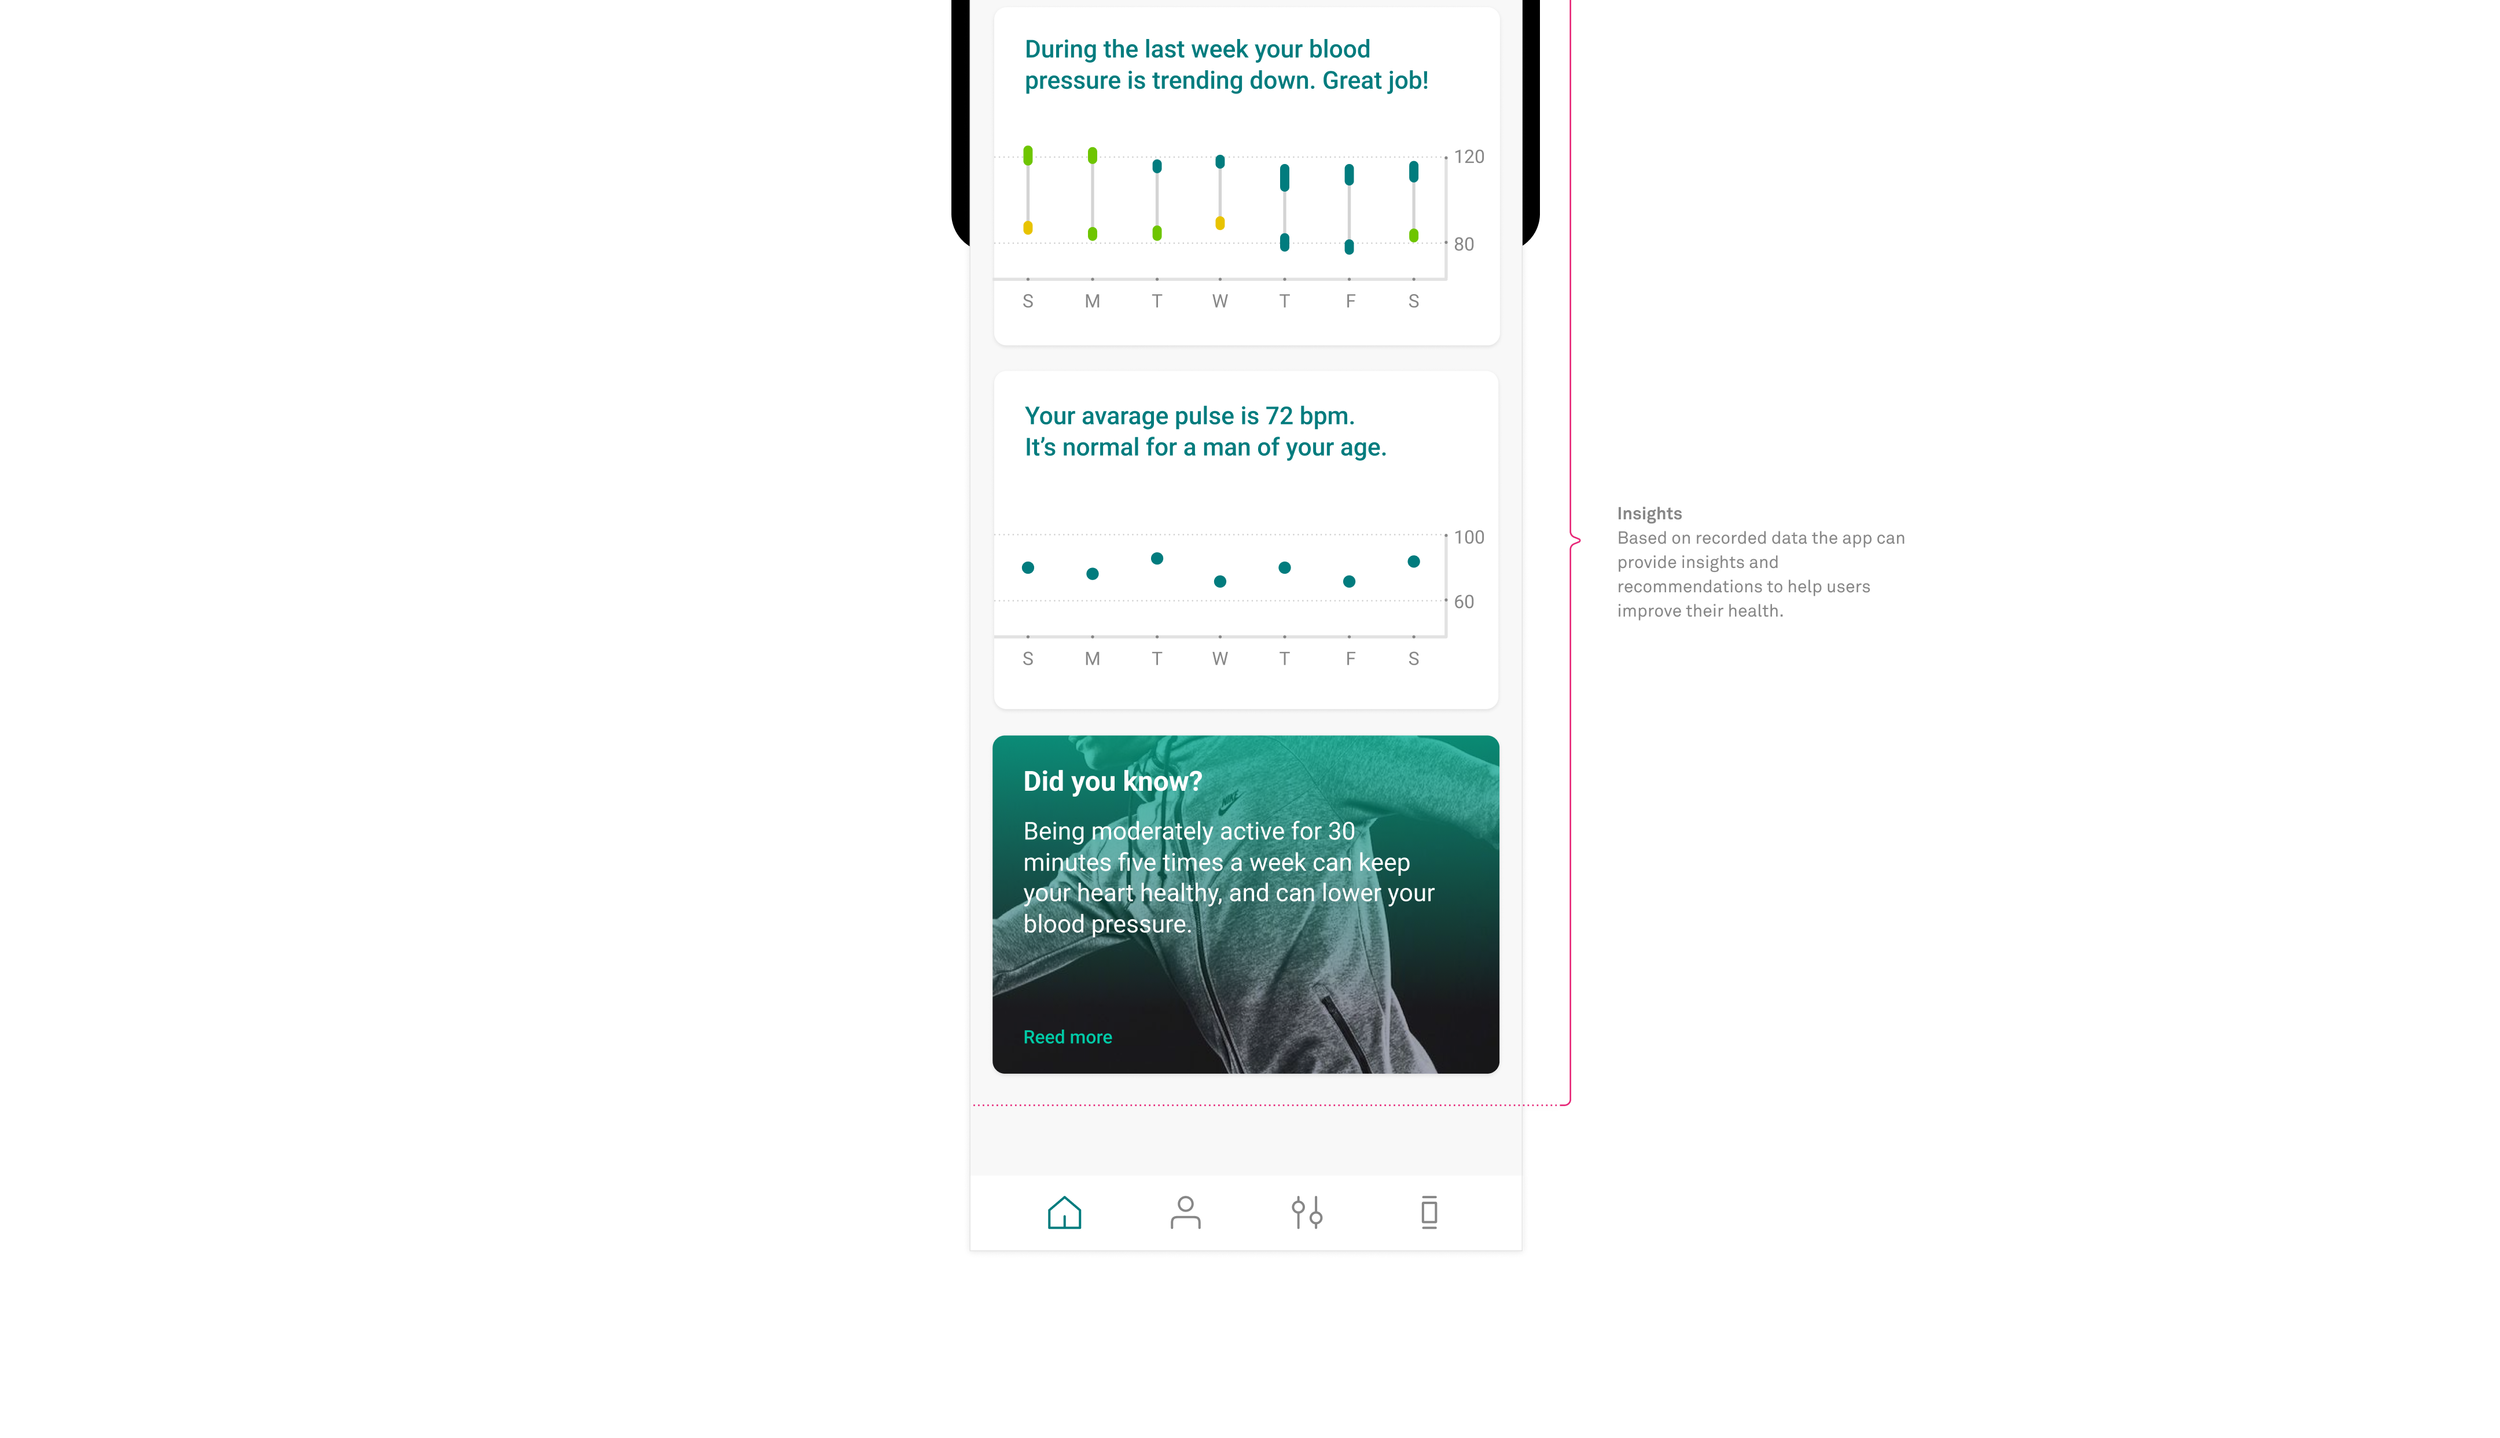
We structured the home screen of the app based on the importance of information for the user. The calendar and overview of the current blood pressure are on top, medication is below, and insights are at the bottom.
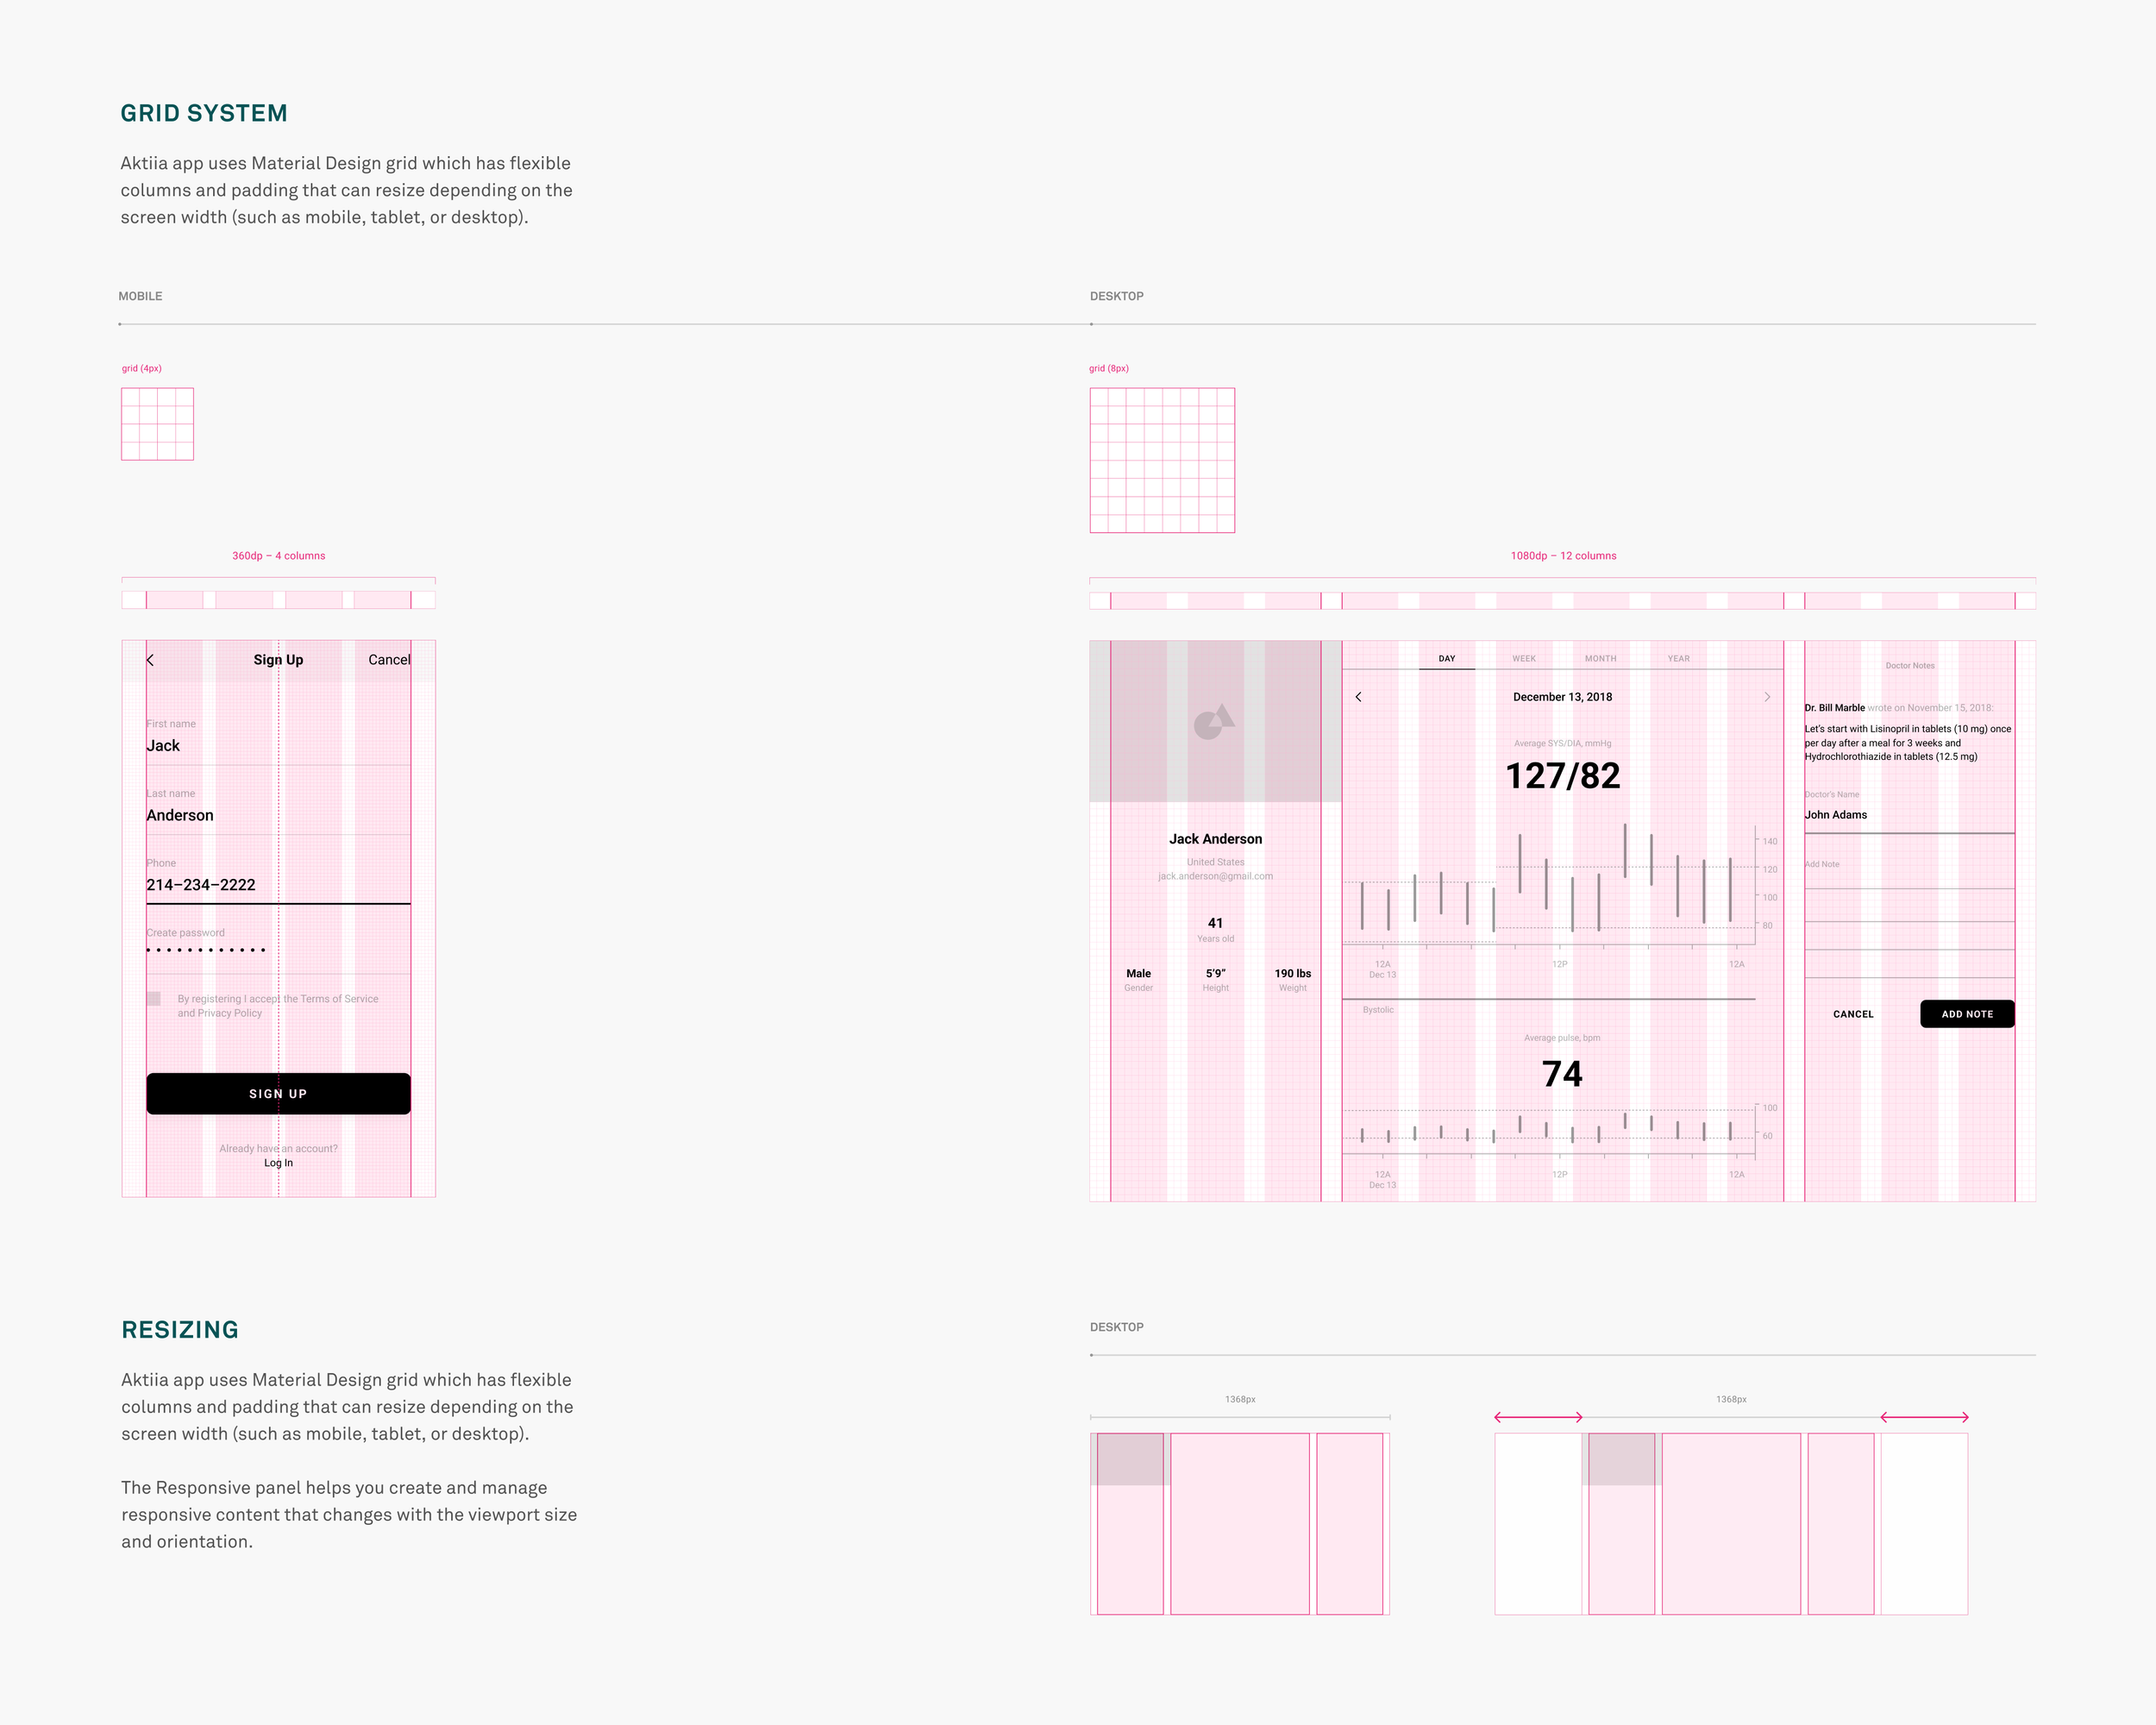
User profile
This user profile page is designed to be accessible for a doctor and is providing basic information about the patient. The doctor can track the progress and will be able to leave a message, adjust the dosage or cancel the medication right on this page.
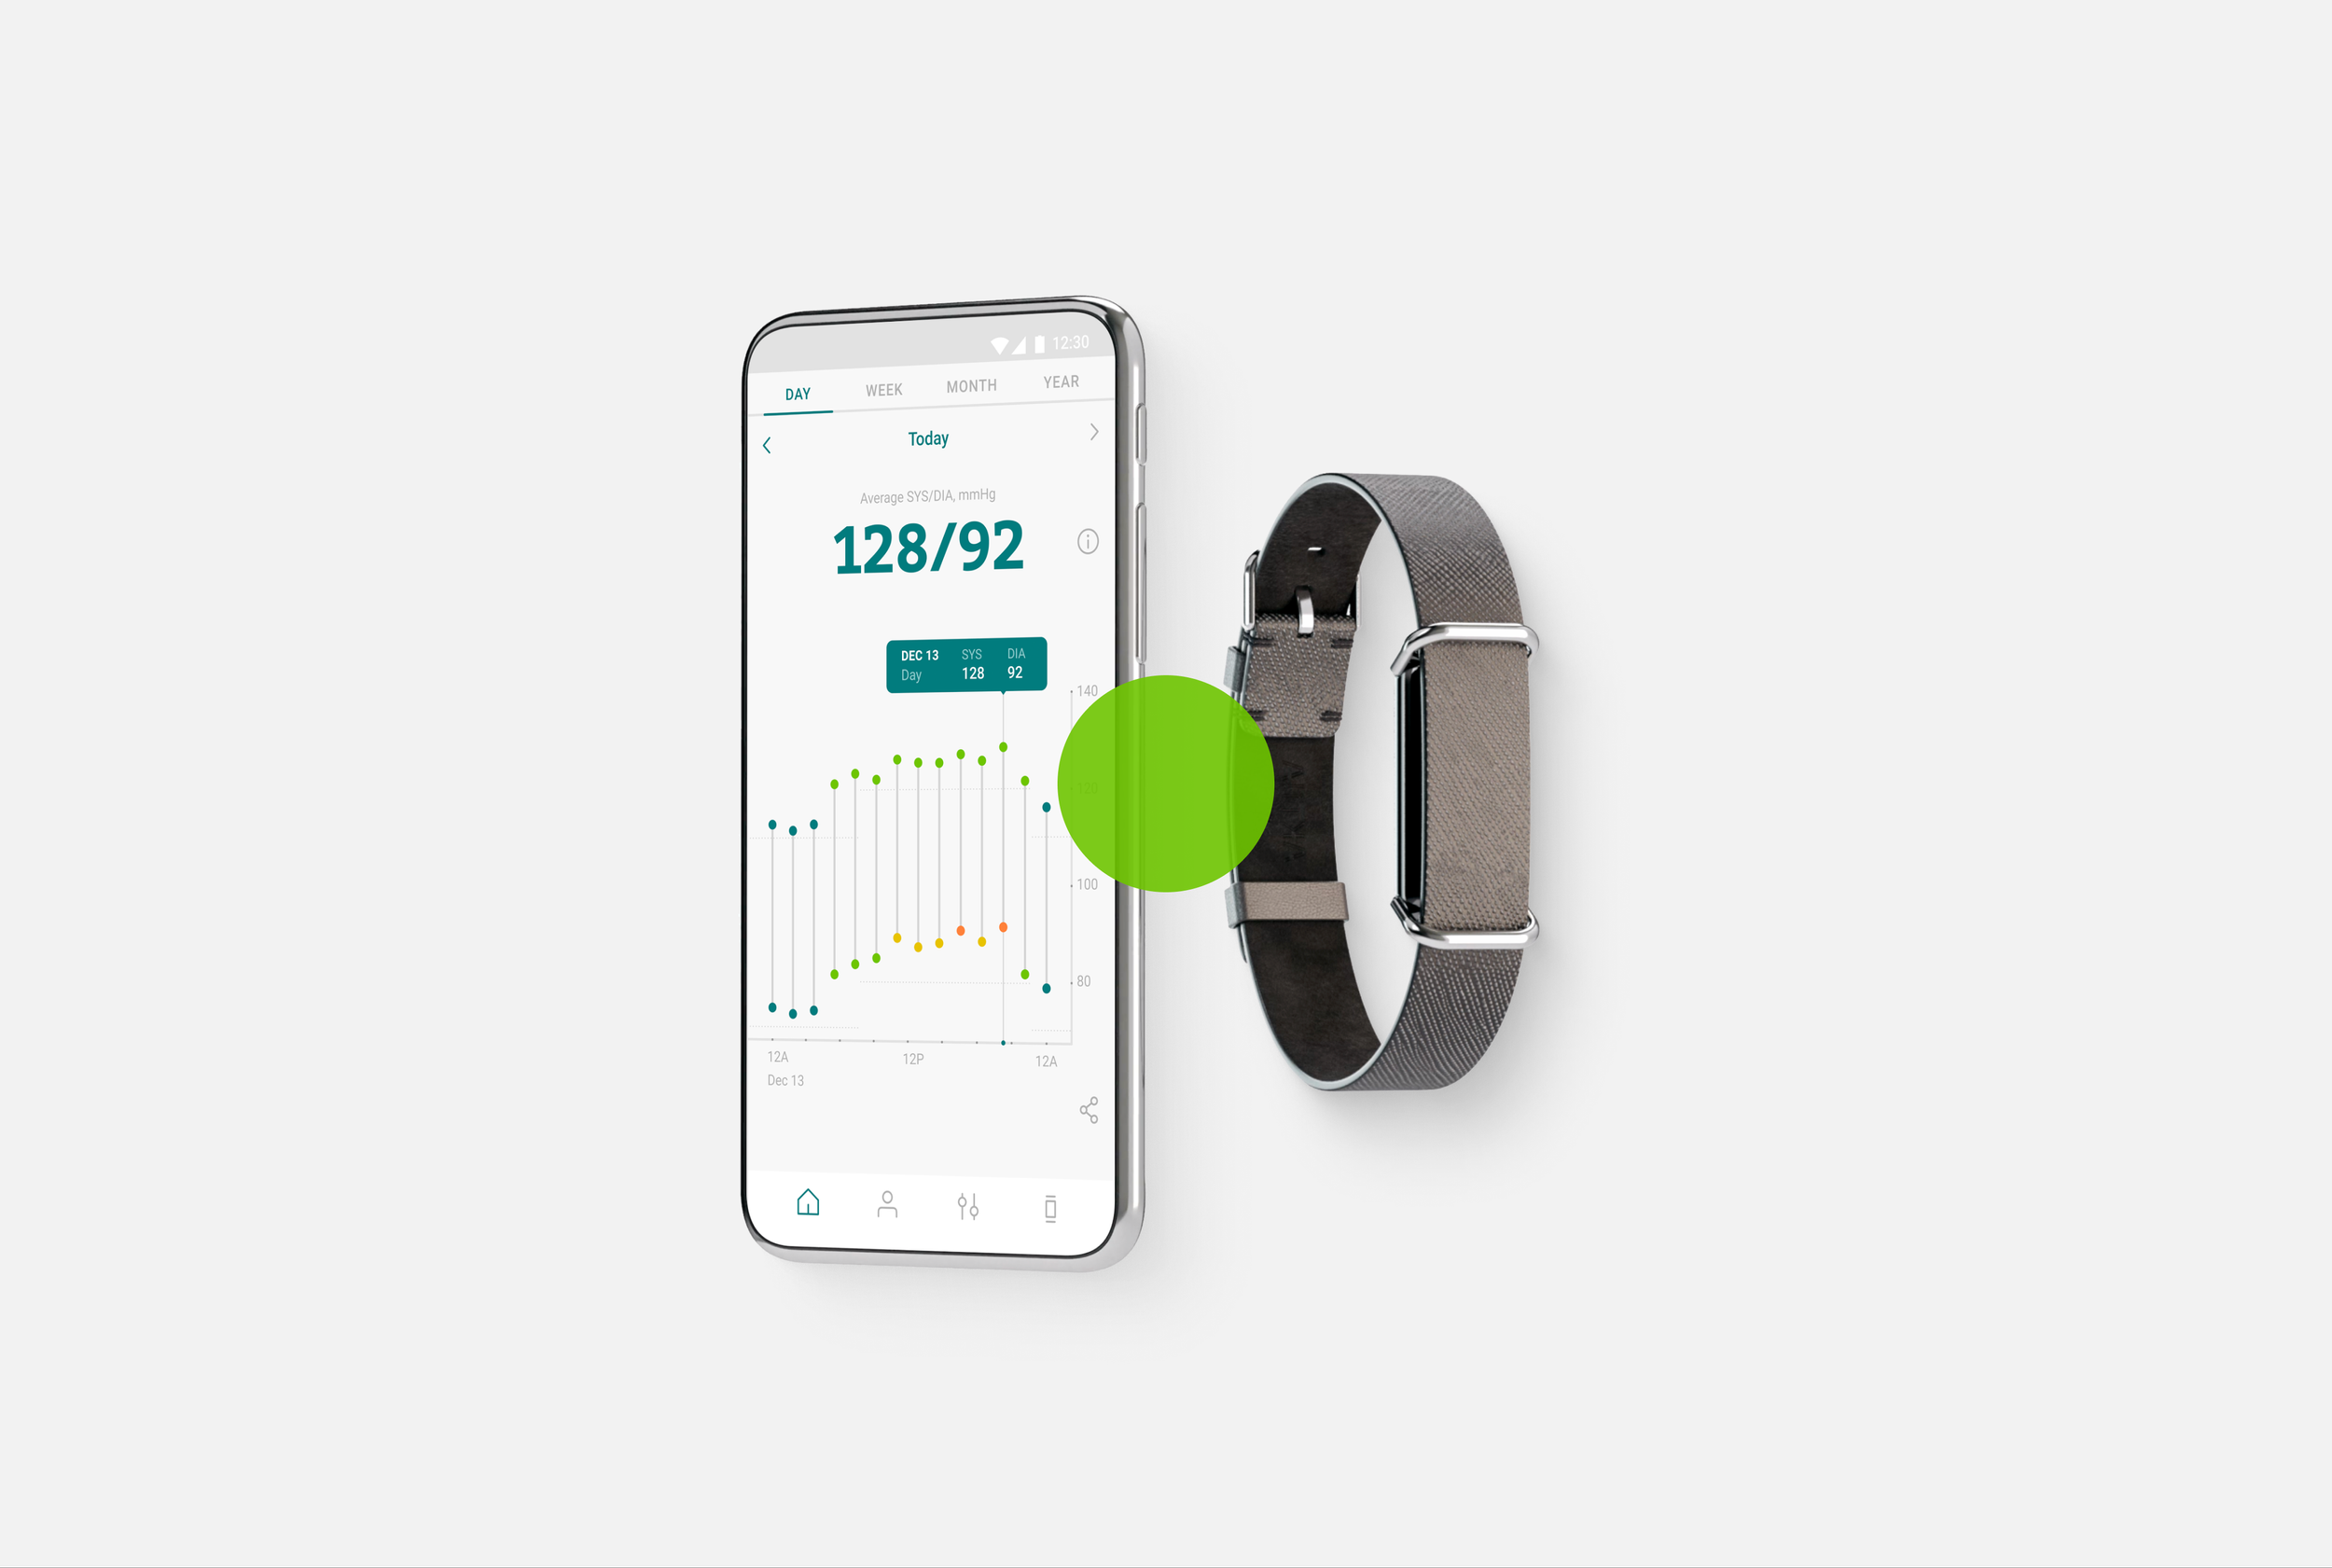
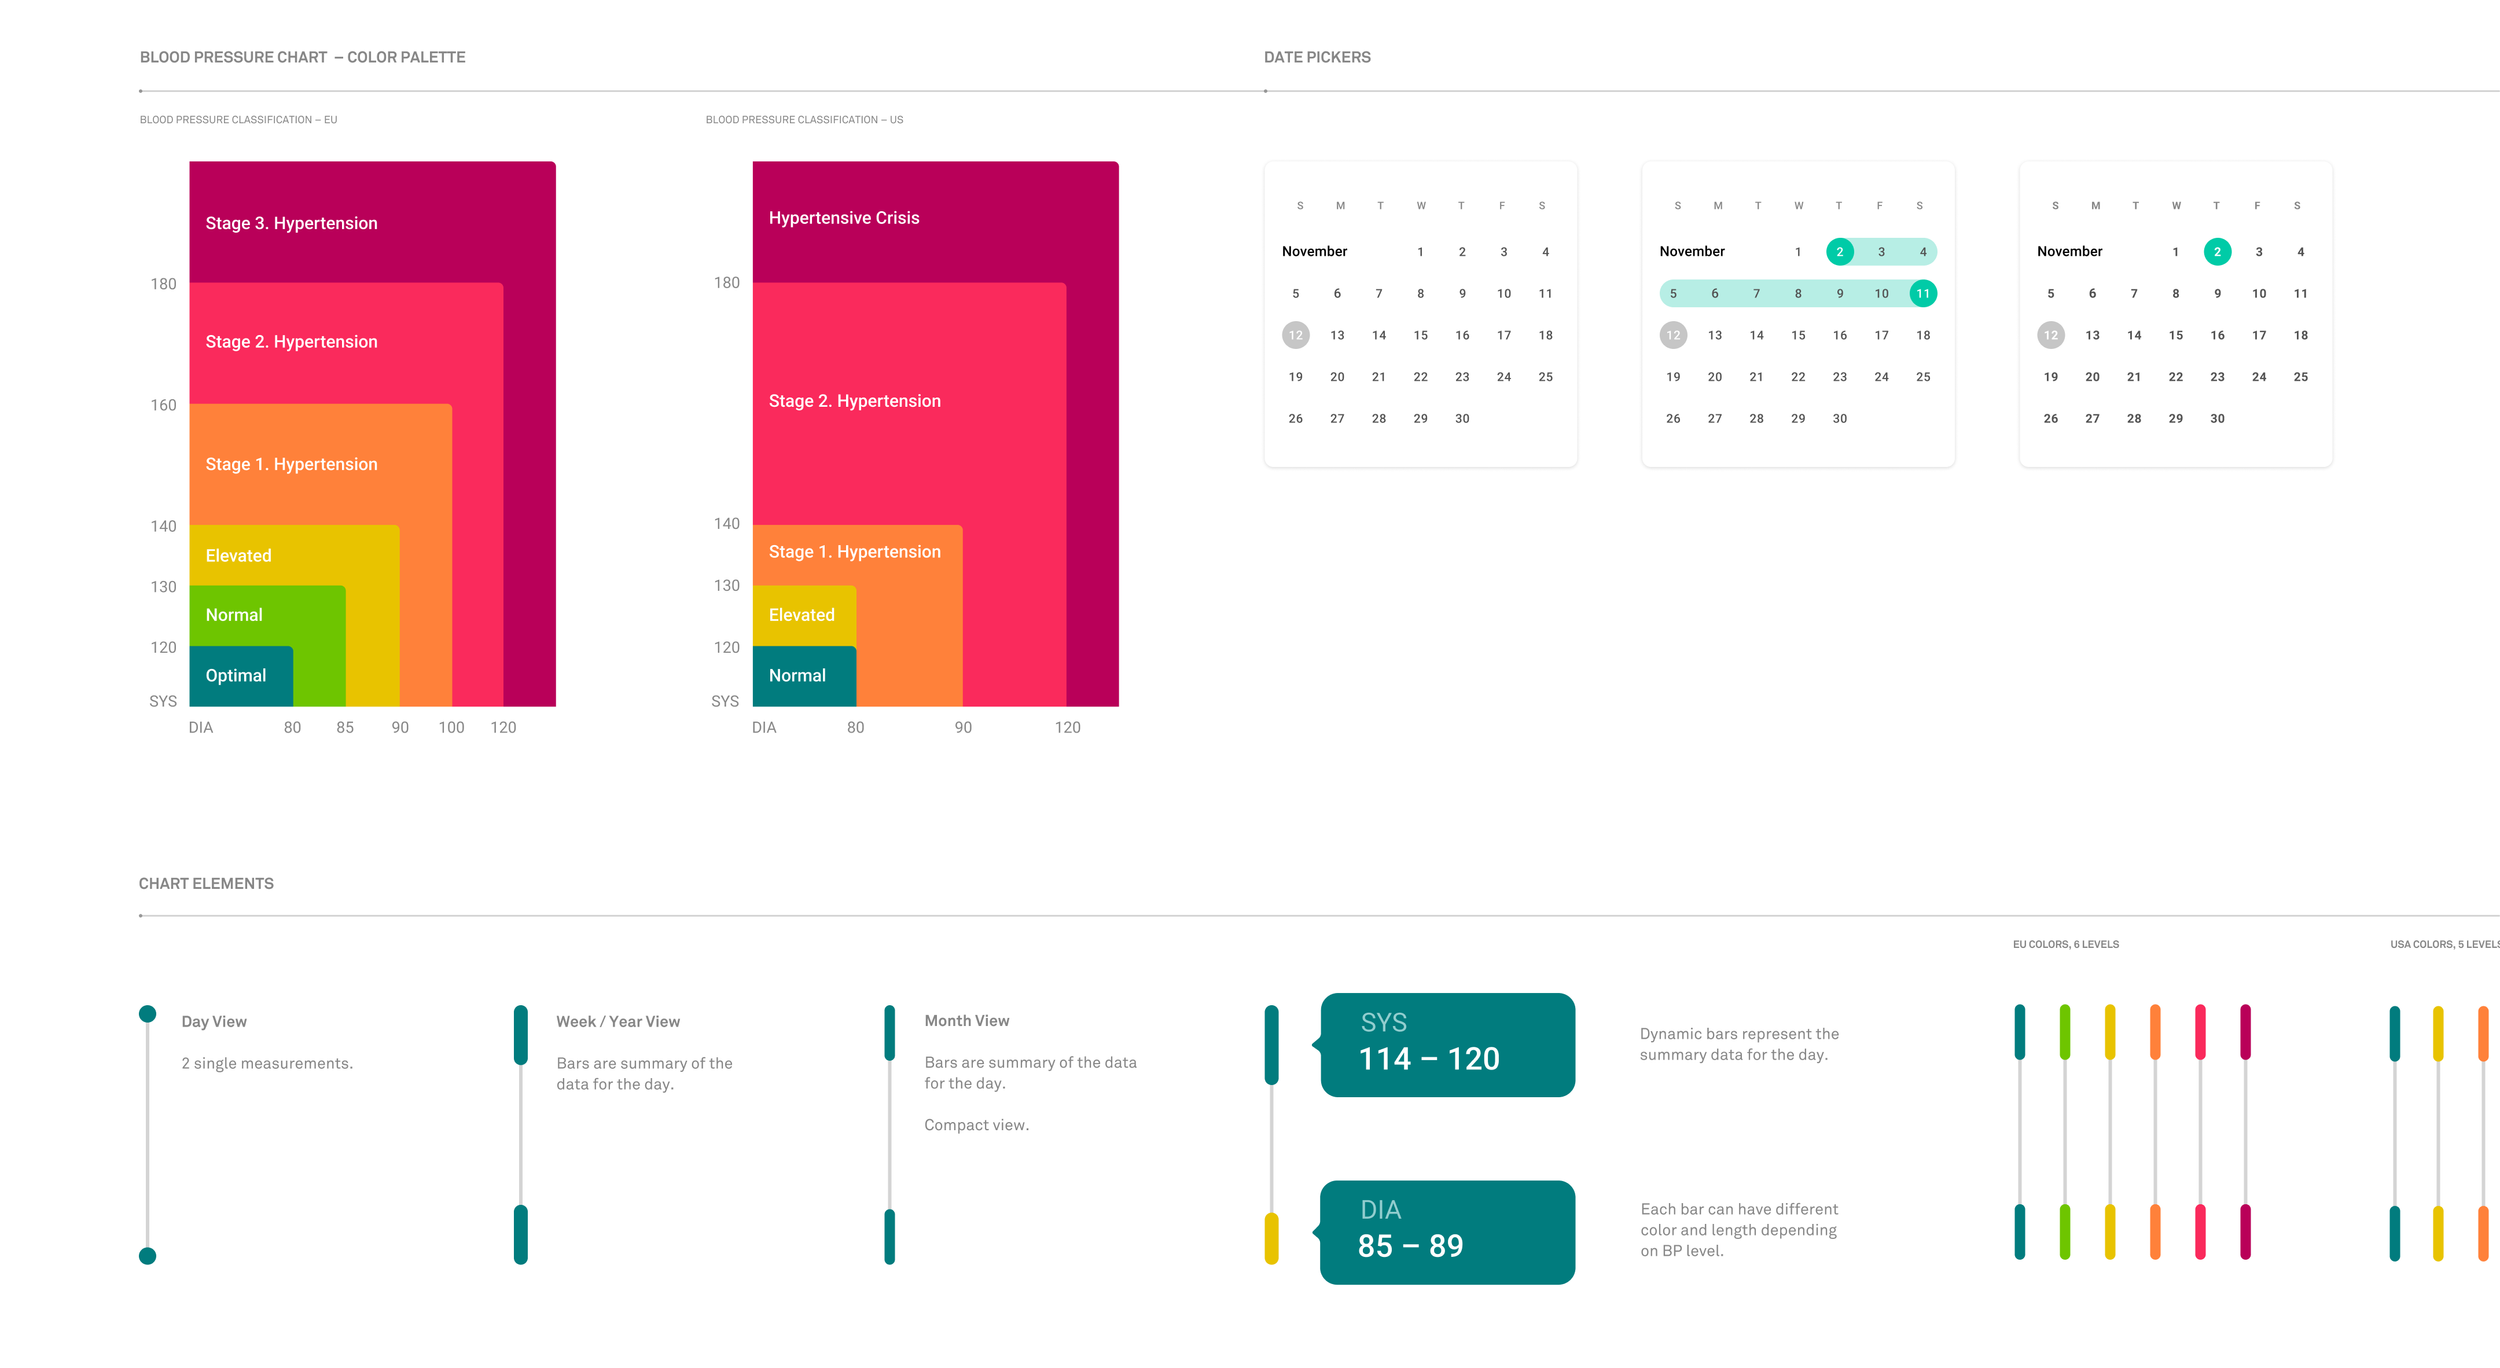
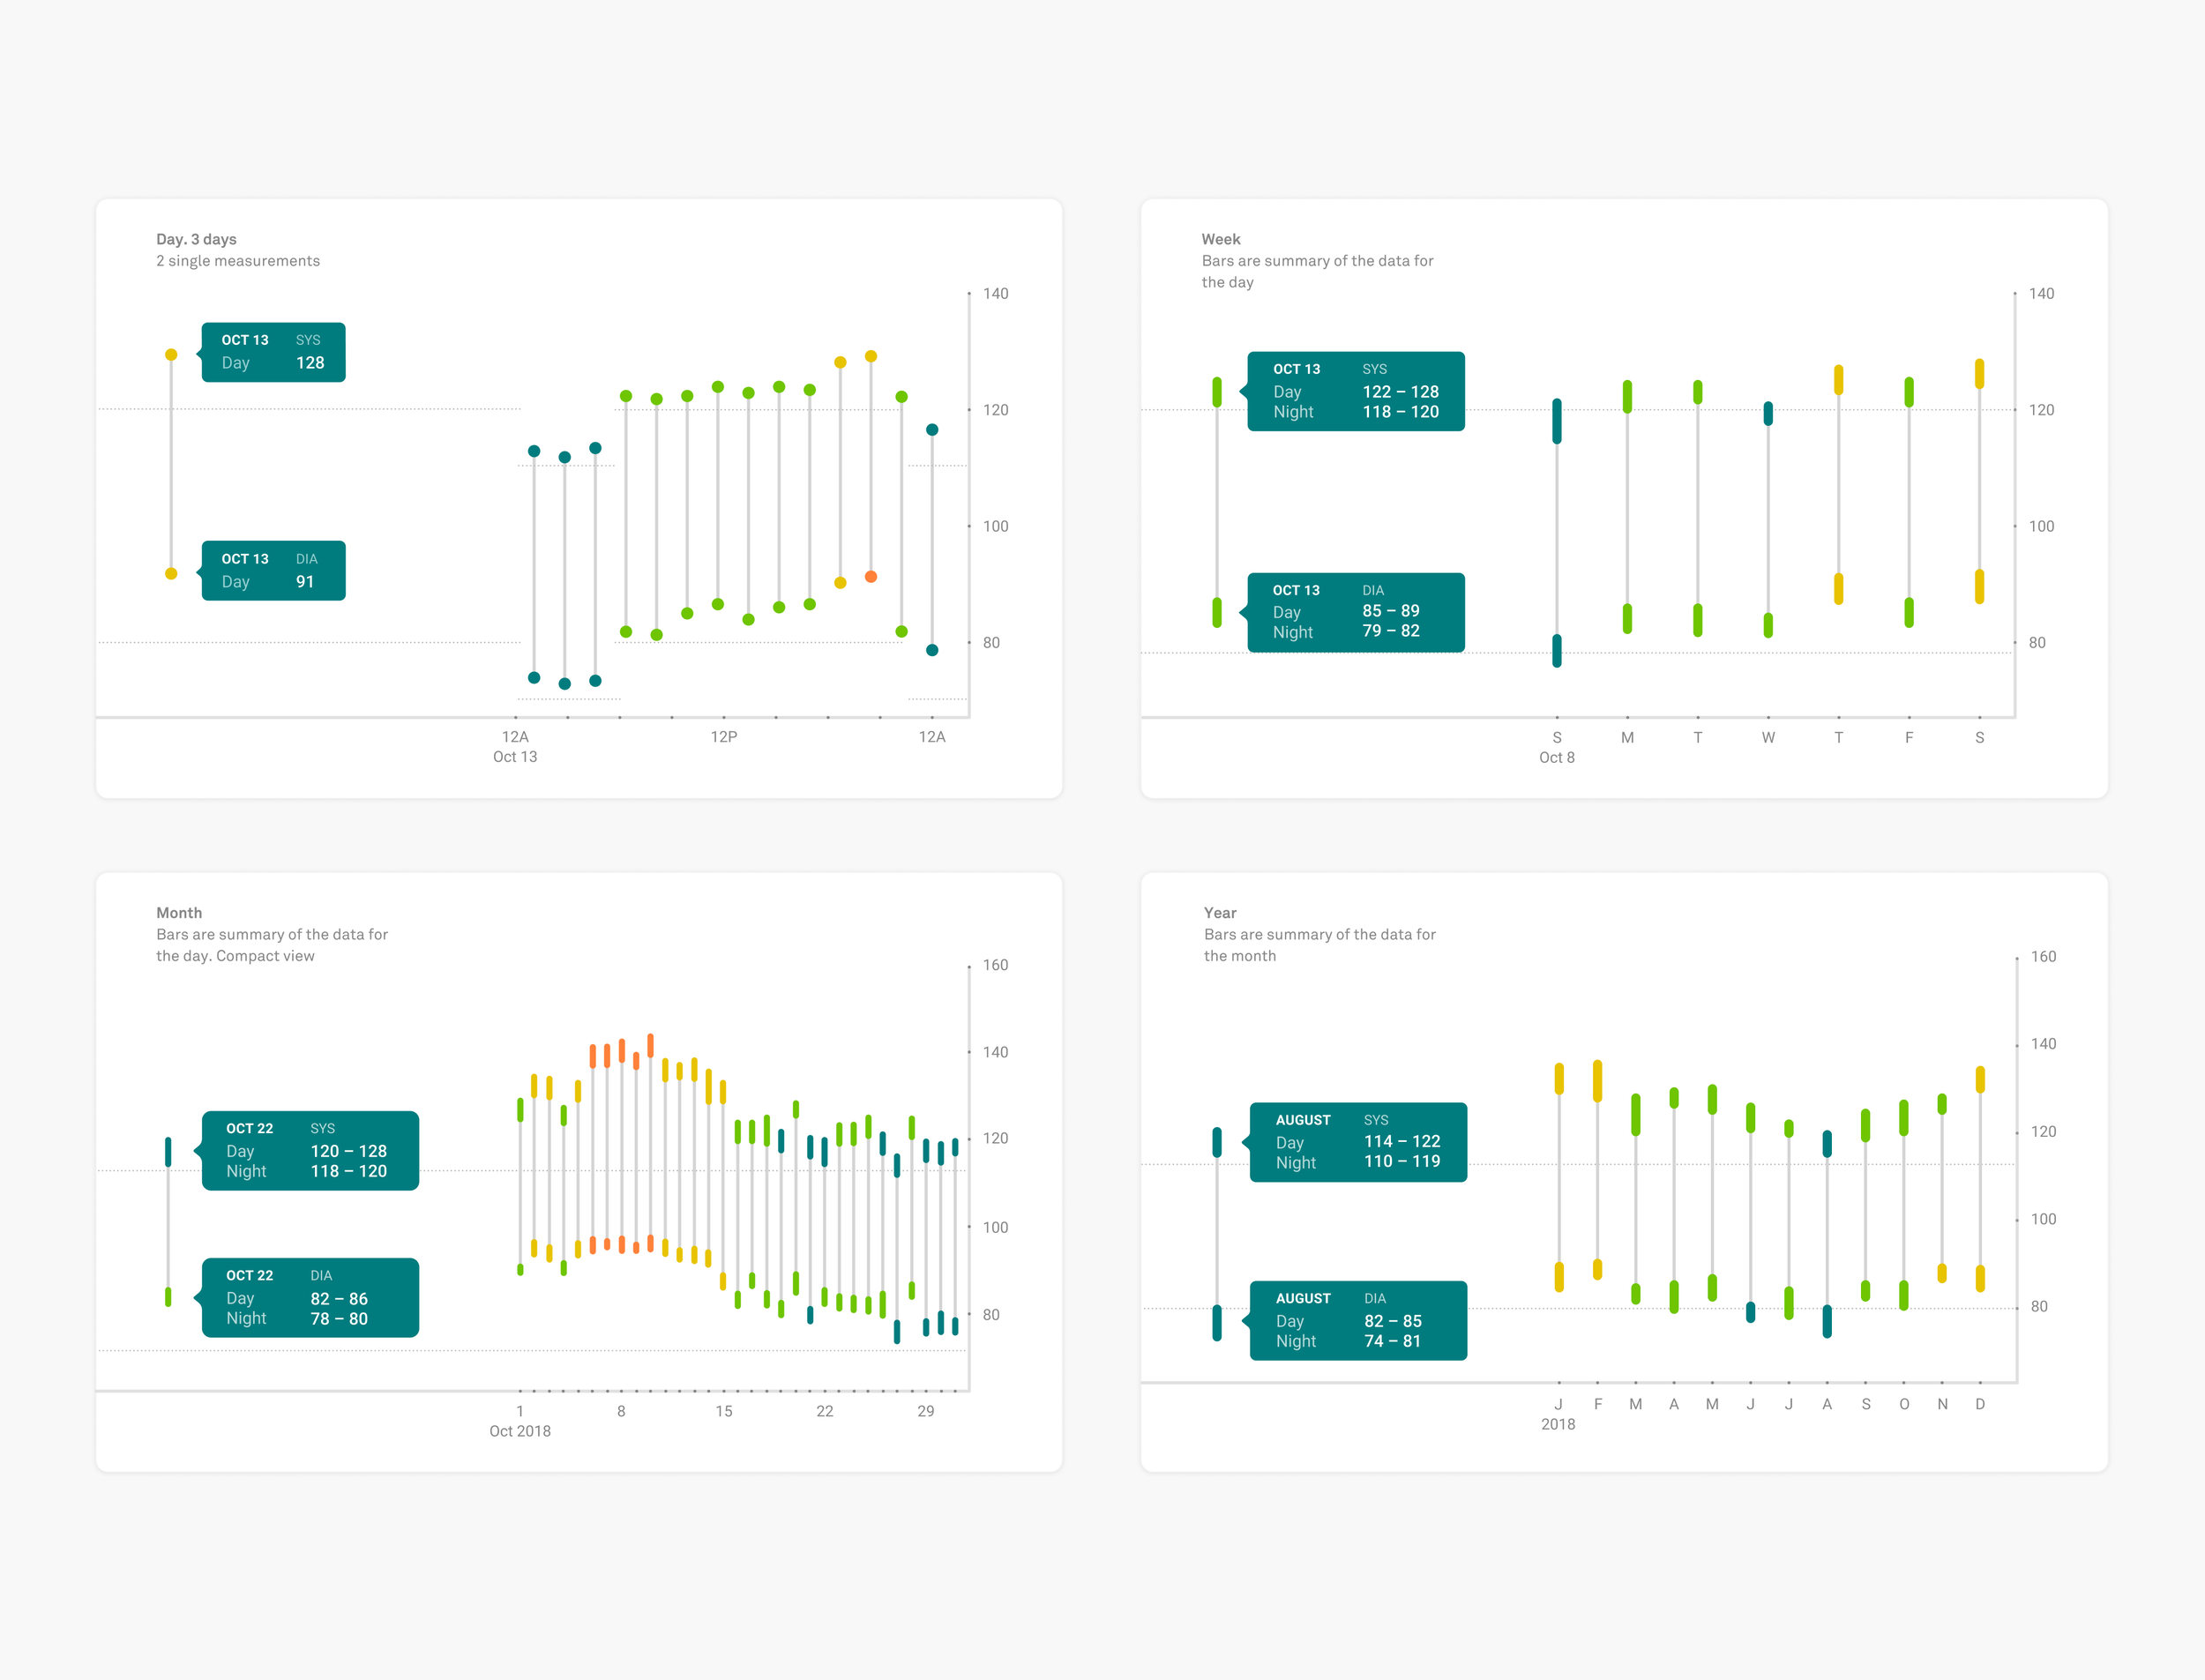
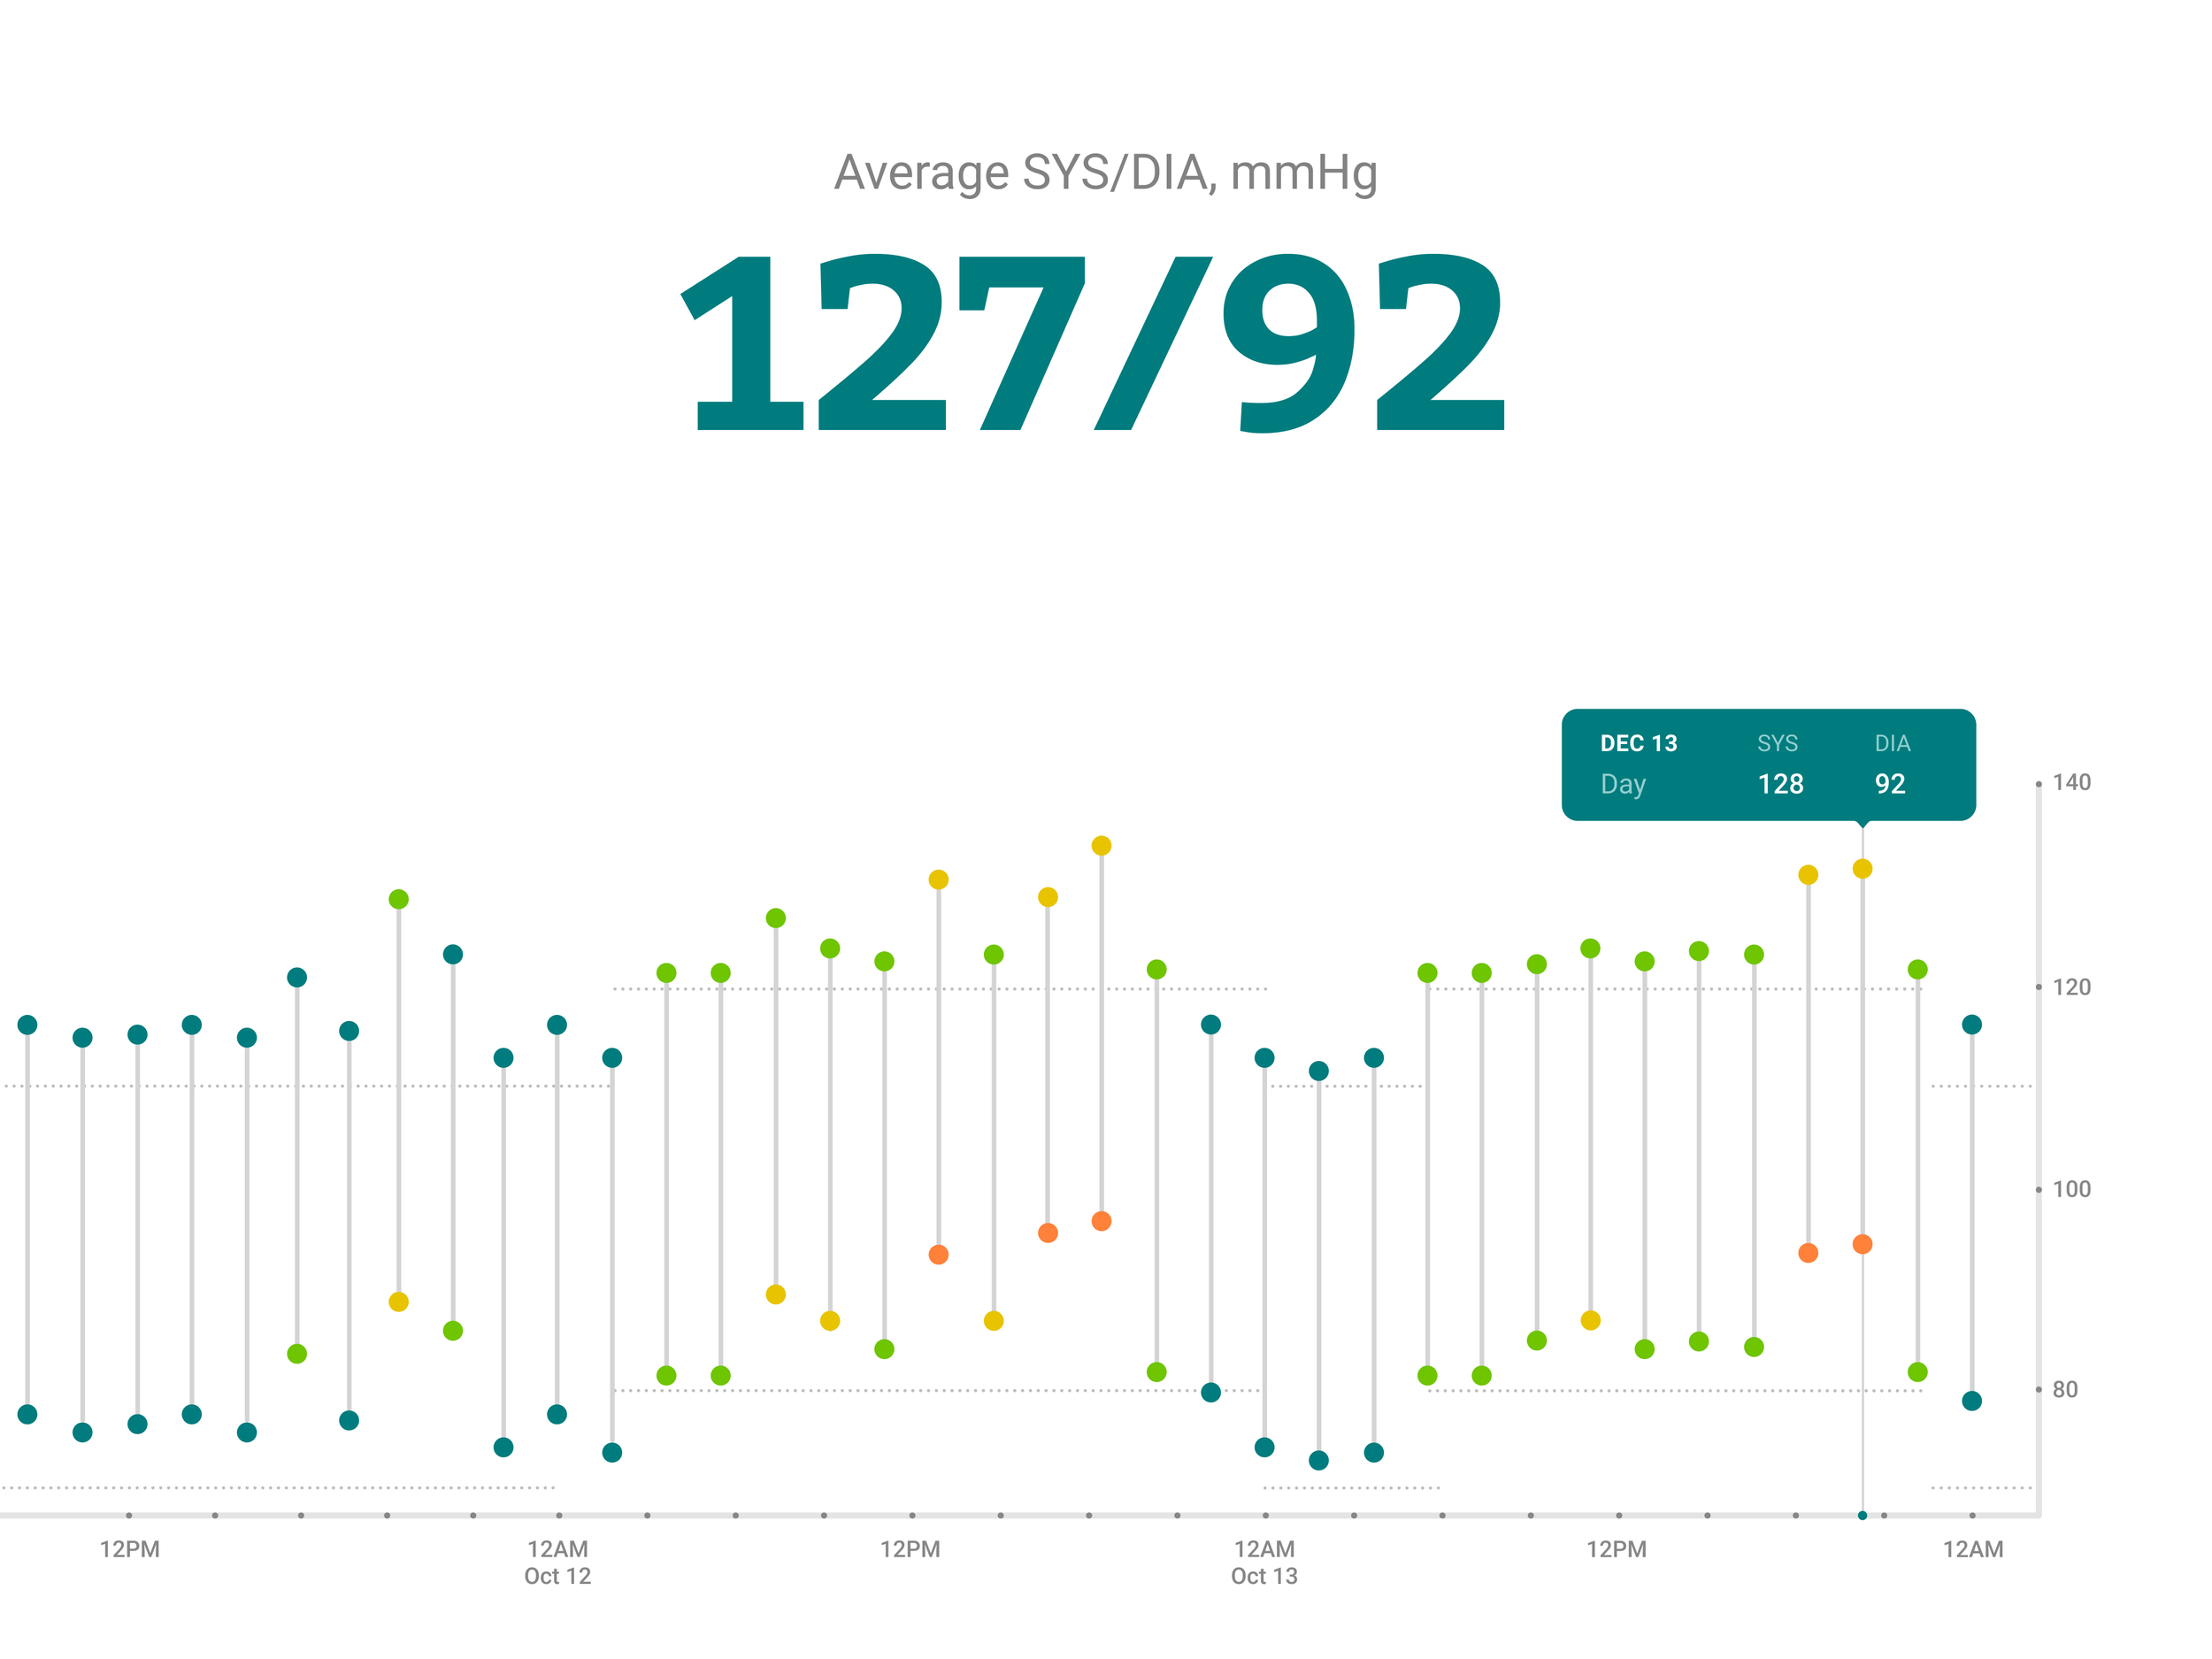
Blood pressure chart
The blood pressure information has been split into 4 tabs: day, week, month and year to have a high and low-level view of the trends. The day view shows the single measurements for SYS and DIA as 2 dots. The rest of the tabs show a summary of the information for each day as dynamic bars.